
Only 2 percent of bachelor’s degrees in economics go to Black women, and only 3 percent go to Hispanic women.
Last month, two Stanford University undergraduate students highlighted these disparities when they penned an op-ed in the Stanford Daily asking, “Why are there so few Black and Latinx students in our economics classes?”
Armelle Grondin and Ana Carolina Queiroz, both women of color studying economics, wanted to better understand this problem — and propose solutions — using data on Stanford students. The Stanford School of Humanities and Sciences denied the students access to the necessary data so, instead, they turned to the publicly available Integrated Postsecondary Education Data System (IPEDS) dataset from the National Center for Education Statistics.
Stanford and other US colleges and universities report information about the number and characteristics of their undergraduates to IPEDS, so Grondin and Queiroz were able to show that Black women are “extremely isolated” in economics at Stanford: not a single Black woman earned a Stanford undergraduate degree in economics in 4 of the 19 years they examined.
Their analysis inspired me to use the Urban Institute’s Education Data Portal to examine similar trends at American universities more broadly. The portal is a one-stop shop for national datasets on schools and colleges, which are available via API, Stata and R packages, and a point-and-click web tool.
Compiling IPEDS data on degrees granted by institution, major, race and ethnicity, and gender over many years using the data files provided by the federal government is a time-consuming process. It requires downloading a separate data file for each year; using a statistical program to read it into a package such as Stata, SPSS, or SAS; and then standardizing variable names and coding to connect the year-specific files into one that can compute change over time.
The Education Data Portal eliminates most of those steps by harmonizing all years of the IPEDS data (and other data sources) and providing easier ways to download and access the data. It now takes only minutes to write a line or two of code to extract multiple years of data, such as trends over time in the number of economics degrees awarded by a particular university.
As a result, it took me only an hour or two to write a flexible Stata program that runs Grondin and Queiroz’s analysis for any college in the US, for any racial or ethnic group, and for any major, not just economics. I wrote the program to pull in more than 20 years of data — the Education Data Portal makes it just as easy to pull many years of data as it does to access a single year of information.
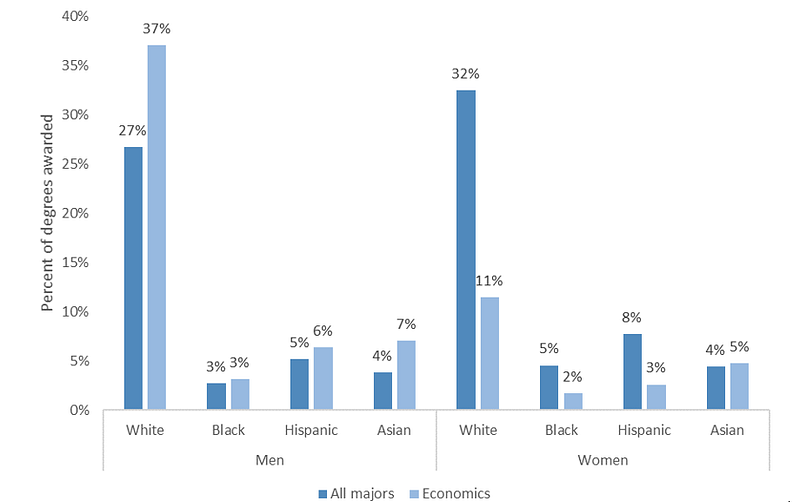
The Stata program allows us to zoom in on particular colleges, and below, I provide two examples. But first, I use a similar approach to take a step back. Looking across all colleges that awarded bachelor’s degrees in economics in the 2016–17 school year, the underrepresentation of women is stark. In addition to the underrepresentation of Black and Hispanic women, only 11 percent of economics degrees went to white women, who earned 32 percent of all bachelor’s degrees at these colleges. Asian people are the only major racial or ethnic grouping where there is approximate parity across genders.
Bachelor’s Degrees Awarded, by Race or Ethnicity and Gender, 2016–17
The Stata program lets anyone re-create Grondin and Queiroz’s Stanford analysis — comparing the representation of Black women in economics to their representation across the university — for any college.
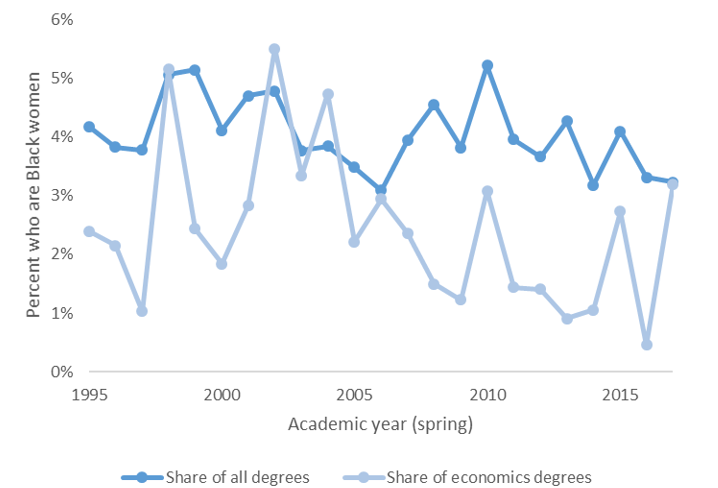
For example, to look at data from Harvard University, another leading economics department, we only need to change the college ID number to 166027 in line 10 of the Stata program. Harvard’s data paint a more nuanced picture: there were no years in which no Black women graduated in economics (as at Stanford). There was approximate parity in 2017 and in many years before 2007, but sizable gaps in most years between 2007 and 2016.
Representation of Black Women in Economics at Harvard University, 1995–2017
The code has already been viewed by almost 200 users on Github and has been used to evaluate the diversity of Northern Kentucky University’s economics program. Adapting the code to extract data on majors other than economics is simple — just change line 12 of the code to specify the Classification of Instruction Programs code for the desired major. And it’s easy to get data on associate’s or graduate degrees by changing the degree level specified in line 11 of the program.
For the selected college, major, and degree level, the code defaults to generating a chart showing representation of Black women. But lines 30 and 31 of the code can be changed to select any gender and race or ethnicity available in the IPEDS data.
Data alone will not solve underrepresentation problems in economics or any discipline, but they can empower brave and enterprising undergraduates like Grondin and Queiroz to draw attention to issues on their own campuses and push for more detailed data that could be used to better understand the problem and propose and evaluate potential solutions. And tools like the Education Data Portal make these data easier than ever to access.
Did you use the Stata code to examine issues of representation on your campus? Tweet your charts, tagging @chingos, or email them to us at [email protected], so we can share them!